Industrial rentals in Epping Industria, Cape Town, have risen from R1.50 per square metre in 1980 to R75 per square metre in 2026 (excluding VAT). That is a fifty-fold increase over 46 years, and it works out to compound growth of 8.88% per annum.
Over the same period, consumer prices grew by 8.10% per annum, or roughly 36-fold. In other words, Epping industrial rentals haven’t just kept up with the rising cost of living. They have comfortably outpaced it.
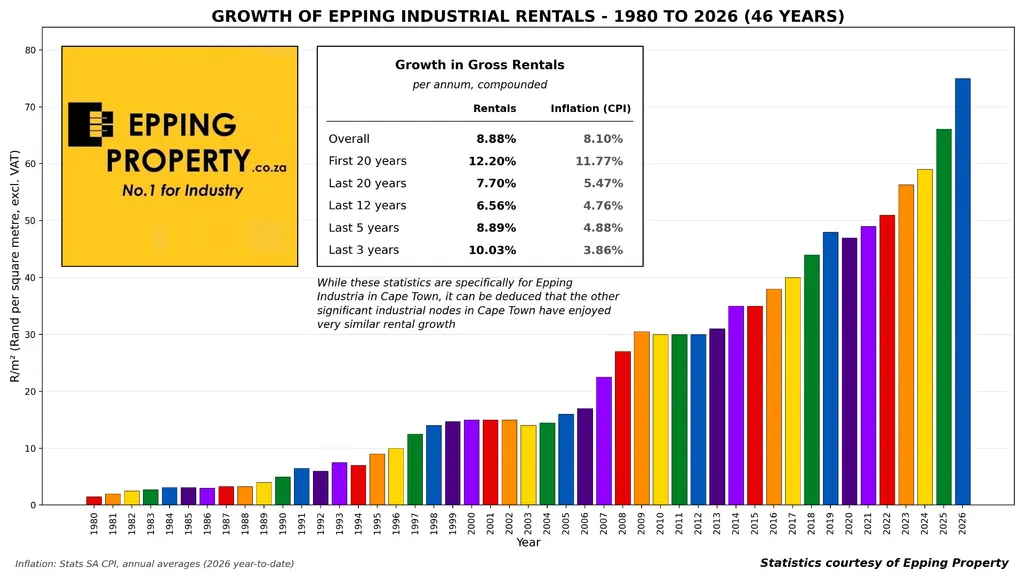
Growth of Epping industrial rentals, 1980 to 2026 (R/m², excluding VAT). Statistics courtesy of Epping Property.
The numbers at a glance
The table below shows compound annual growth in gross rentals over six different periods, compared with inflation (measured by the consumer price index) over the same periods.
| Period | Rental growth p.a. | Inflation p.a. (CPI) | Rentals above inflation p.a. |
| Overall (1980 to 2026, 46 years) | 8.88% | 8.10% | 0.72% |
| First 20 years (1980 to 2000) | 12.20% | 11.77% | 0.38% |
| Last 20 years (2006 to 2026) | 7.70% | 5.47% | 2.11% |
| Last 12 years (2014 to 2026) | 6.56% | 4.76% | 1.72% |
| Last 5 years (2021 to 2026) | 8.89% | 4.88% | 3.82% |
| Last 3 years (2023 to 2026) | 10.03% | 3.86% | 5.94% |
All rentals exclude VAT. Rental statistics supplied by Epping Property. Inflation based on Stats SA CPI (annual averages; 2026 year-to-date).
Four decades, three distinct phases
1980 to 2000: high growth in a high-inflation era
The first 20 years produced the strongest percentage growth, with rentals climbing from R1.50 to R15 per square metre, a ten-fold increase and compound growth of 12.20% per annum. Context matters, though. This was a period of very high inflation in South Africa, which averaged 11.77% per annum over the same 20 years. Rentals grew faster than prices, but only just: strong in headline terms, modest after inflation.
2000 to 2013: plateaus and a sharp surge
The following years were less linear. Rentals stayed at R15 per square metre from 2000 to 2002 and eased slightly to R14 in 2003 before gradually recovering. Then came a sharp surge: between 2006 and 2009, rentals rose from R17 to R30.50 per square metre, an almost 80% increase in three years. After that jump, the market consolidated, with rentals holding at around R30 to R31 per square metre from 2009 to 2013.
2014 to 2026: a steady climb that has recently accelerated
From 2014, rentals rose steadily from R35 per square metre to R48 in 2019, with only a marginal dip to R47 in 2020. Since then, the pace has quickened. Rentals reached R56.30 in 2023, R66.10 in 2025 and R75 in 2026, an increase of 13.5% on the previous year. Over the last 12 years, growth averaged 6.56% per annum, the quietest long-term period, yet it still comfortably beat inflation of 4.76%.
Beating inflation, and by a widening margin
The most important comparison for any property owner or tenant is what happens to rentals after accounting for inflation. The long-term story is positive, and the recent story is even stronger.
- Over 46 years: rentals grew 50-fold while consumer prices grew roughly 36-fold.
- Over the last 20 years: rentals grew roughly 4.4-fold, while inflation grew roughly 2.9-fold.
- Over the last 5 years, rentals grew about 53%, while cumulative inflation rose about 27%.
- Over the last 3 years, rentals grew by about 33%, while cumulative inflation was about 12%. That is growth at more than 2.5 times the inflation rate.
The Western Cape effect
The Western Cape has seen extraordinary growth over the last five years, and this has been a key driver of excess rental growth during this period. Rentals have grown at 8.89% per annum since 2021, against inflation of 4.88%, and the last three years’ pace, 10.03% per annum, is the strongest of any recent period measured.
What this means for Cape Town’s industrial property market
Long-term data of this kind shows how industrial property has performed through very different economic conditions: the high-inflation years of the 1980s and 1990s, the 2008 global financial crisis, the pandemic years of 2020 and 2021, and the recent period of Western Cape growth. For owners, rental growth that has consistently beaten inflation over the long run is a meaningful track record. For tenants and prospective tenants, it reminds them to plan space requirements and lease terms with the longer-term trend in mind.
While these statistics are specific to Epping Industria in Cape Town, you can infer that other major industrial nodes in Cape Town have seen similar rental growth.
Past performance does not guarantee future results, and rentals for individual properties vary with location, size, specification, and condition.
About these statistics
The rental figures are gross rentals in Rand per square metre for Epping Industria, Cape Town, excluding VAT, supplied by Epping Property. Growth rates are compound annual rates calculated between the first and last year of each period. Inflation figures are based on Statistics South Africa’s consumer price index, using annual averages; the 2026 figure is based on the average of the monthly readings available for the year to date (January to September 2026) and may change once the full year’s data is published.
Looking for industrial space in Cape Town?
Epping Property is No.1 for Industry. Get in touch to discuss your industrial property requirements.
Statistics courtesy of Epping Property.